Customer Segmentation Using R Programming
Customer Segmentation Using R Programming
1. IMPORT DATA
data <-read.csv("C:/Users/aishw/Downloads/train-set.csv")
head(data)
str(data)
summary(data)
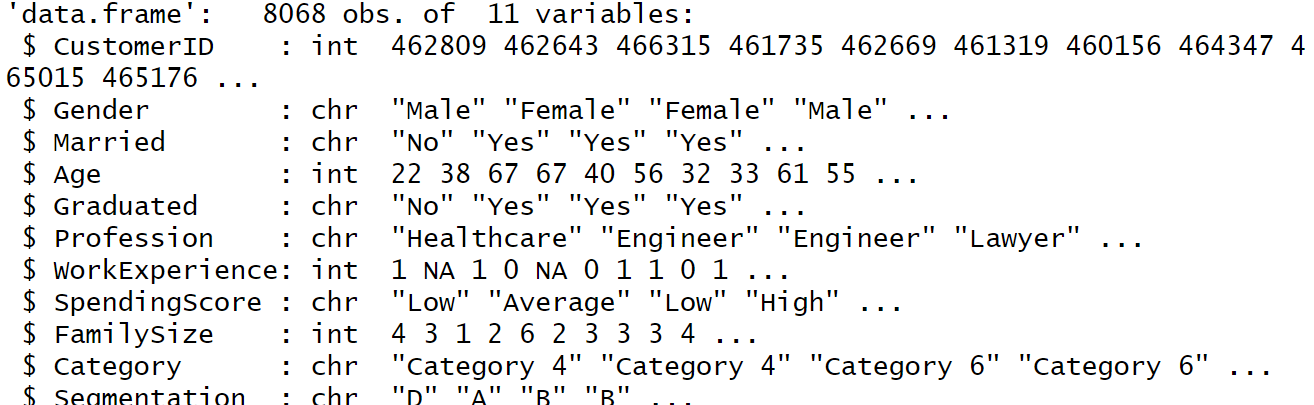

This R code explores a CSV file. It reads the data (read.csv), previews the first few rows (head), examines the data structure (str), and summarizes the data (summary) to give you a quick understanding of what you're working with before further analysis.
2. DATA PREPROCESSING
{r}
cleaned_data <- data[complete.cases(data), ]
print("Cleaned Dataframe:")
print(cleaned_data)
data=cleaned_data

This code cleans the data by removing rows with missing values and then replaces the original data with the cleaned version. This is often a crucial step in data analysis, as missing values can lead to errors or inaccuracies in calculations and modeling. By cleaning the data, you ensure a more reliable foundation for further analysis.
3. K-MEANS CLUSTERING
{r}
if (!is.data.frame(data)) {
stop("Data should be in data frame format, not a list.")
}
if (any(sapply(data, function(x) any(is.na(x))))) {
stop("Data contains missing values. Please preprocess your data accordingly.")
}
if (any(sapply(data, function(x) any(is.infinite(x))))) {
stop("Data contains infinite values. Please preprocess your data accordingly.")
}
numeric_cols <- sapply(data, is.numeric)
set.seed(20)
k <- 4 # Number of clusters
kmeans_result <- kmeans(data[, numeric_cols], centers = k)
data$cluster <- kmeans_result$cluster
# Display the dataframe with cluster labels
print("Dataframe with Cluster Labels:")
print(data)

This code snippet checks your data format, validates for missing and infinite values, selects numeric columns, performs K-Means clustering with a predefined number of clusters, assigns cluster labels to each data point, and finally displays the data frame with the cluster information.
4. DENDOGRAM
distance_matrix <- dist(data)
clust.single <- hclust(distance_matrix, method = "single")
clust.average <- hclust(distance_matrix, method = "average")
#Dendrograms
plot(clust.single, main = "Single Linkage Dendrogram")
plot(clust.average, main = "Average Linkage Dendrogram")
clust.single <- hclust(distance_matrix, method = "single")
clust.average <- hclust(distance_matrix, method = "average")
#Dendrograms
plot(clust.single, main = "Single Linkage Dendrogram")
plot(clust.average, main = "Average Linkage Dendrogram")


This code performs hierarchical clustering on a data frame. It first calculates the pairwise distances between all data points (distance_matrix). Then, it performs hierarchical clustering using two different linkage methods: single and average. Single linkage considers the closest data points when merging clusters, while average linkage considers the average distance between all points in two clusters. The code generates dendrograms (tree-like structures) for each linkage method to visualize how data points are grouped based on their similarities. These dendrograms help identify potential cluster structures within the data.


Comments
Post a Comment